Three tools, one workflow. Built for trainees without breaking how experts already worked.

Tool 1 Tool 2 Tool 3 One workflow DesignExecuteEvaluate
My role
Team of 2 with the Design Head. I owned research, UX and UI, design system and the client pitch.
TEAM COLLABORATION
Product manager, scientists, engineer
Time
A client project as consultant for 4 months
Managed by
Design Head of consultancy
Problem

A lab machine ran on 3 separate software tools. Trainees jumped between them, made errors, and needed months of training to learn them.

Solution

3 tools > 1 software having 3 modes: Design, Execute, Evaluate.
Experts keep their habits, trainees stop switching.

Outcome

Improved workflow efficiency
for trainees by 42%
for experts by 32%
Lab equipment on a bench
Context

Eight years of growth left one lab machine with three tools.

A research lab uses a machine to test protein samples in bulk.
Someone designs an experiment, commands the machine to run it, then studies the results. Three specialised software tools cover those three jobs.

A life-science company that builds protein bulk-testing machines and the software that automates them. It sells to enterprise: laboratories, research centres.

Over eight years its software grew into three separate tools. The company asked engineers to streamline it first. They tried and couldn't solve it. So we came in. It wasn't a data problem. It was a human one.

Problem

Experts coped navigating scattered data out of habit. But trainees still learning the software paid the price. 

Tool 1 Tool 2 Tool 3
3

software tools for one machine

~3.5

months (estimated) for trainees to learn 3 tools

$400+

cost of error. 1 misread setting leads to wastage of resources 

Data overlap, inconsistency created confusion. Impacted efficiency

Data sat across different tools with varying names. If one tool handled two tasks, another handled those two plus a third. Daily tasks were cluttered. Rarely used actions and custom controls sat next to daily ones.

Built for 2 users, but it only served the experts.

Experts coped out of habit. Trainees had to learn the compromised flow from scratch.

High cost of error

Errors were more common for trainees. One misread setting could waste resources and leave a ghost result: no trace of what went wrong. That is why training was so extensive.
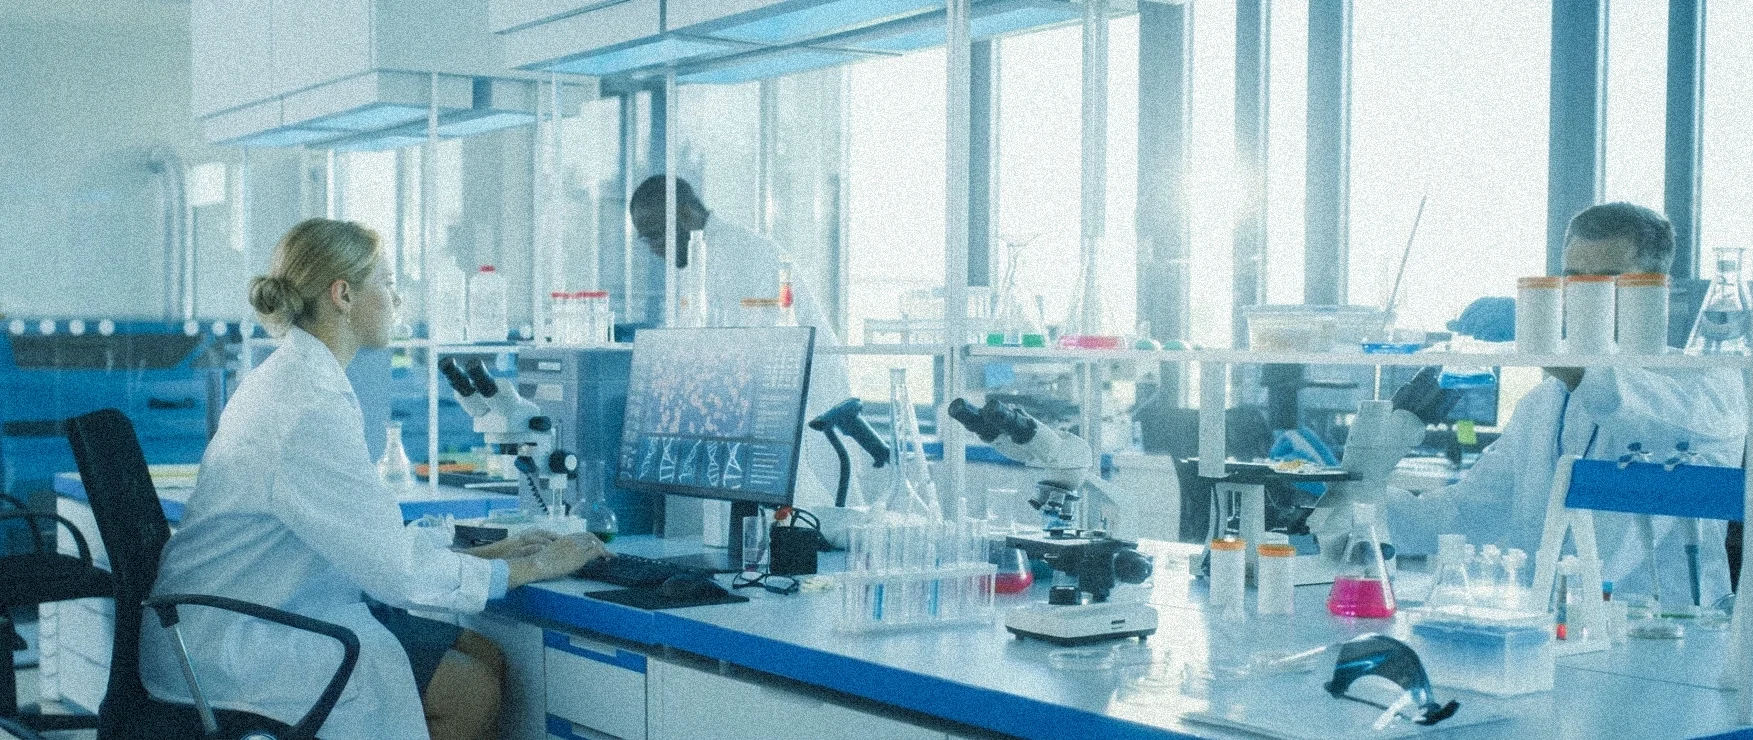
Scientists at lab benches with microscopes, sample tubes and analysis software on screen
Goal

Make it learnable for trainees without breaking workflow for the experts. Bring consistency. Reduce risk of errors.

Challenge

A system so complex. Users couldn't explain it as a whole.

Fragmented knowledge

In 3 walk-throughs, every stakeholder knew their own part and couldn't explain the system.

Time pressure

Limited research and execution time. Pressure from investor to launch.

Open brief

The brief was open. I shaped it with them

Process

I learnt the lab system by
using it, deconstructing it and asking specific questions.

Breaking it down

With a 130-page manual and access to their training simulator, I took screenshots of each button and their reaction.

Understand by task and priority mapping

I tracked what data each experiment ticket (the record that moves from Design to Evaluate) carried before and after every step. I compared which details mattered most, then built the data and user flow.

?

Show and tell. Co-creation with clients

I went through the data and task flow with specific questions. These got me insights that shaped my design decisions.

DESIGN DECISION · 1/4

One workflow, three modes: Design, Execute, Evaluate.
Consistent terms for experts & trainees.
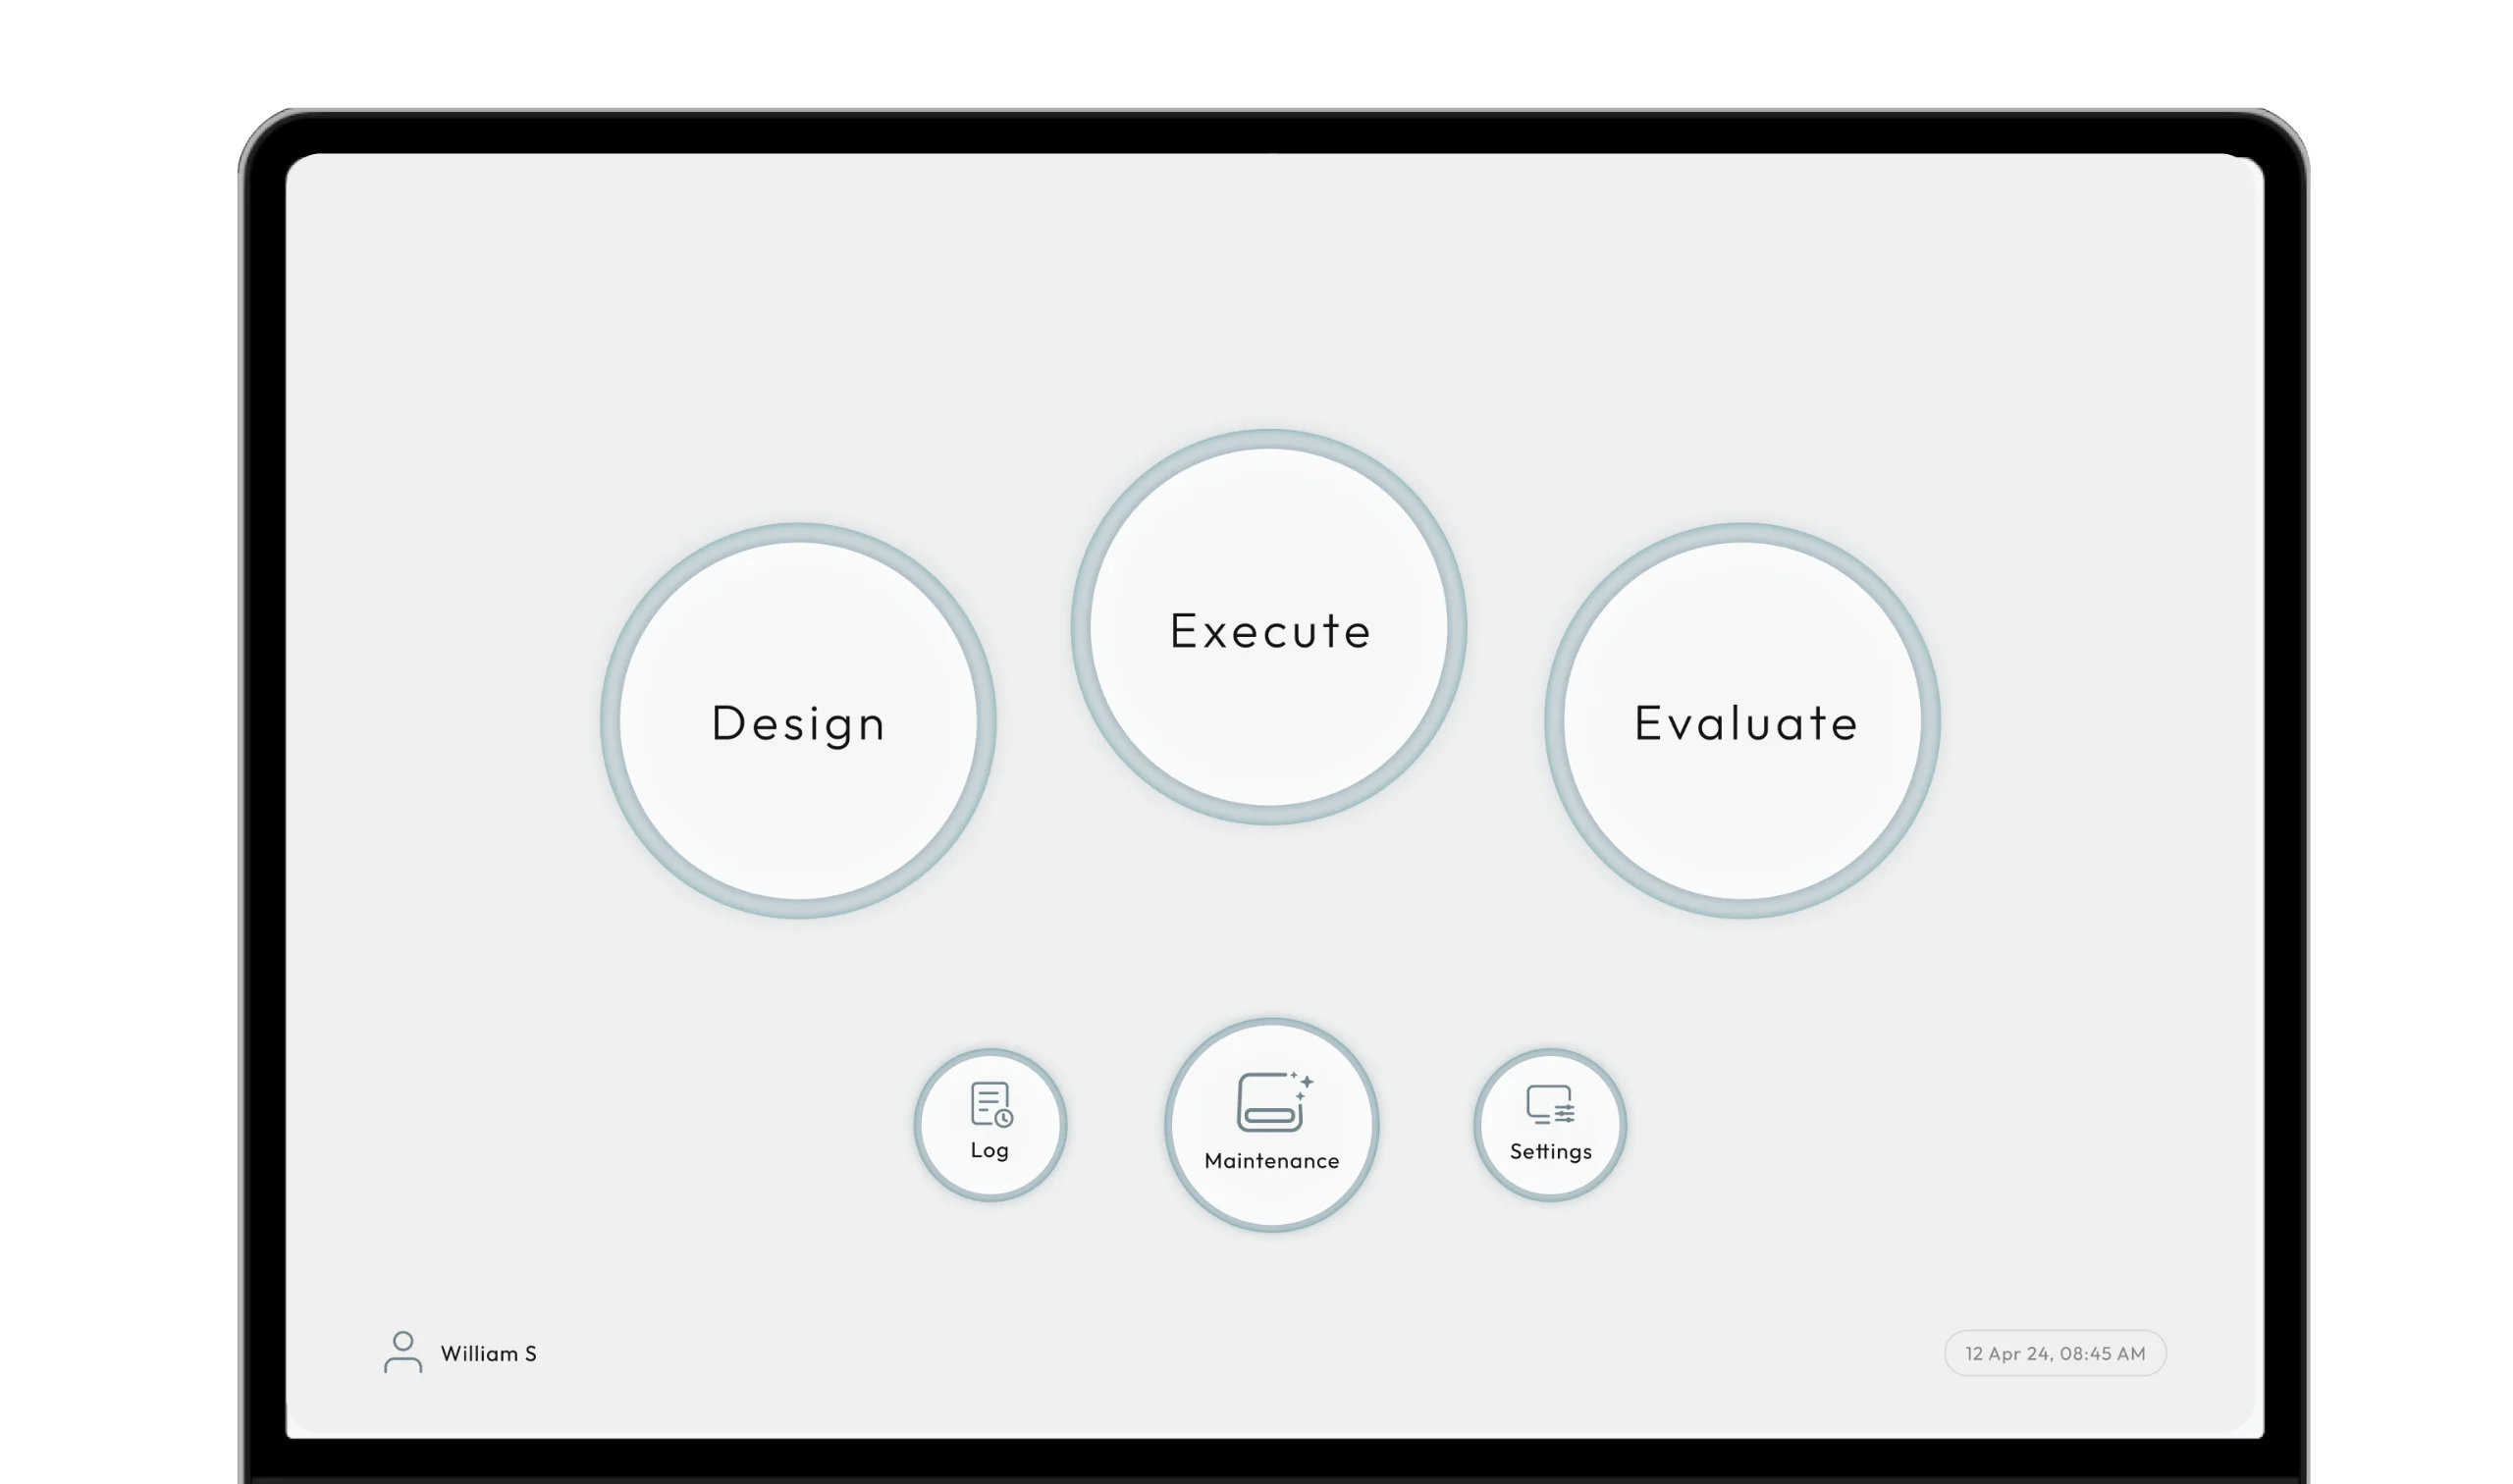
Tool 1 Tool 2 Tool 3 Design Execute Evaluate Home screen with three large circular buttons: Design, Execute and Evaluate. Smaller buttons for Log, Maintenance and Settings sit below.
Insight

Roles blur. One person designs, runs & analyses. Or three people do.

An expert (scientist) might design an experiment, a technician runs it in another room, and an analyst studies the results. Or one person does all three tasks.

DESIGN DECISION

Task based workflow as one size fit for varying users

I skipped role-based views and built task-based modes. This fits single or multiple users for one workflow. Three modes: Design, Execute and Evaluate.

Outcome

No juggling between tools. No confusion. An experiment moves in one line through the 3 modes.

Same mental model, so experts didn't have to relearn, and trainees got one workflow without jumping between tools. The ticket keeps the same terms in every mode, which gave both users a common vocabulary.
DESIGN DECISION · 2/4

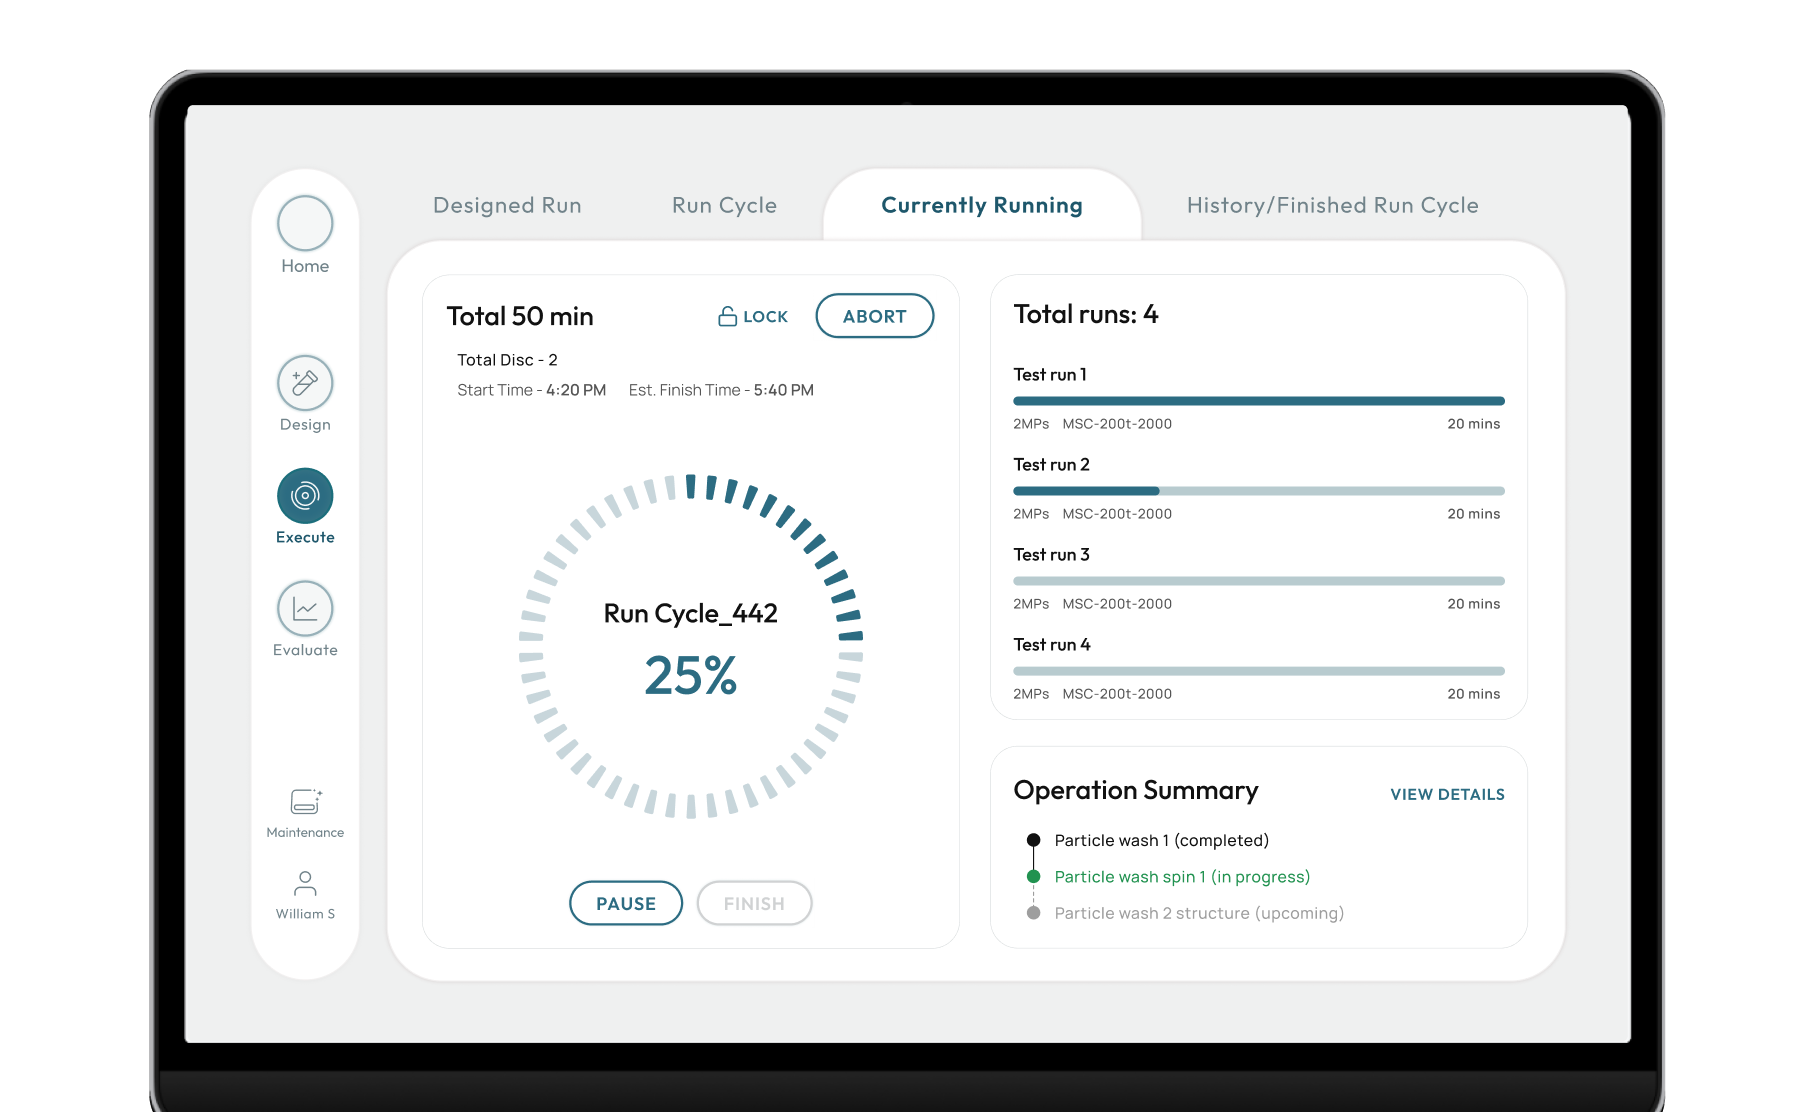
Risky readings sit where they are easy to scan, compare and act on

Execute screen with risky readings, test time and details shown up front
Insight

An error in choosing the right set-up of apparatus can waste resources and precious samples.

DESIGN DECISION

I put the risky readings and test time up front in the run list, so people can spot a problem and act without opening each run. That made scanning easy and decisions quick.

Outcome

Built to reduce human error: risky data sits where it is hard to miss.
Trade-off: 1 extra click to see details.

DESIGN DECISION · 3/4

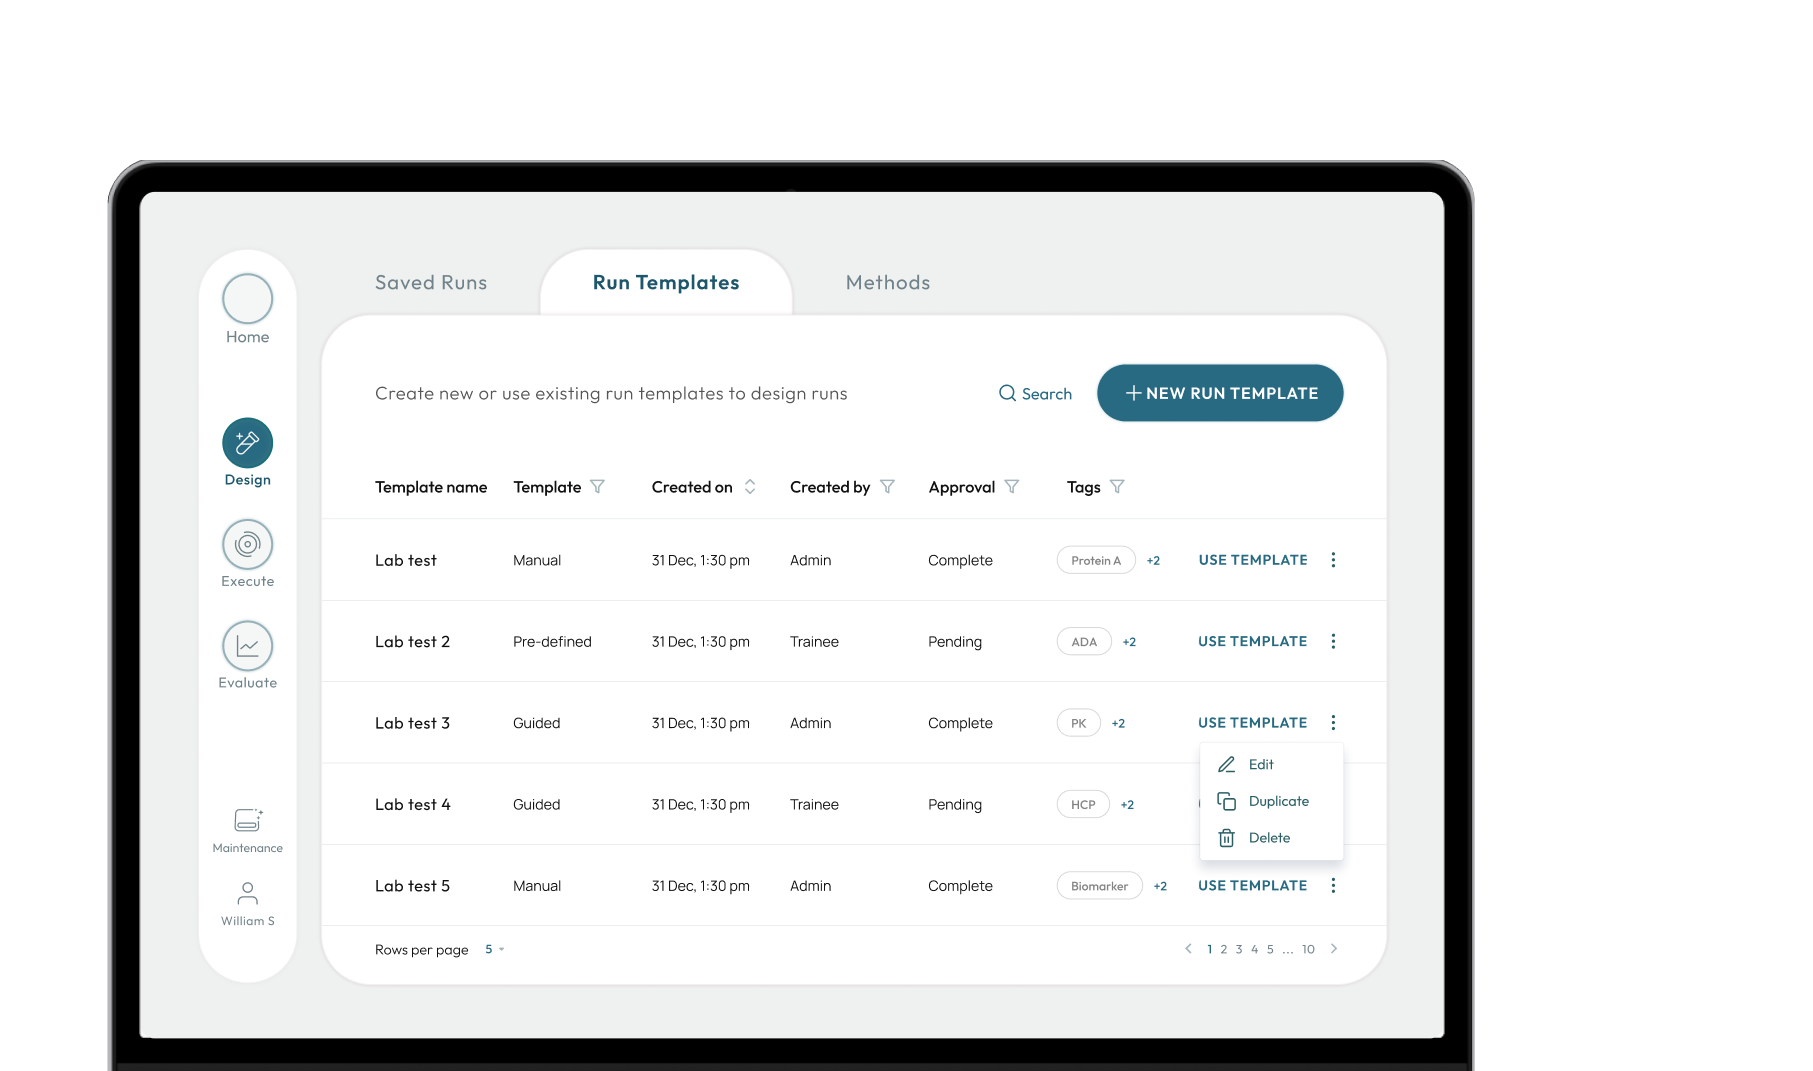
Everyday actions get priority. Specialist controls sit 2 clicks deeper.

Design CustomEdit Template
Maintenance
DailyCustom actionDaily actionOccasional actionCustomDaily action
DailyDailyDailyDaily
OccasionalOccasional
More details
CustomCustomCustom
Design screen with daily actions up front and custom controls under More details
INSIGHT

Technicians told me they mostly edit pre-made templates and rarely build an experiment from scratch.
But custom experiment actions sat next to daily actions. This added confusion and increased errors.

DESIGN DECISION

I mapped the key actions by frequency: daily, occasional (like monthly maintenance) and custom. I hid custom controls under "More details".

Trade-off

Custom controls went from 1 click to 3. Daily tasks got lighter, and scientists kept their specialist controls.

Design Decision · 4/4

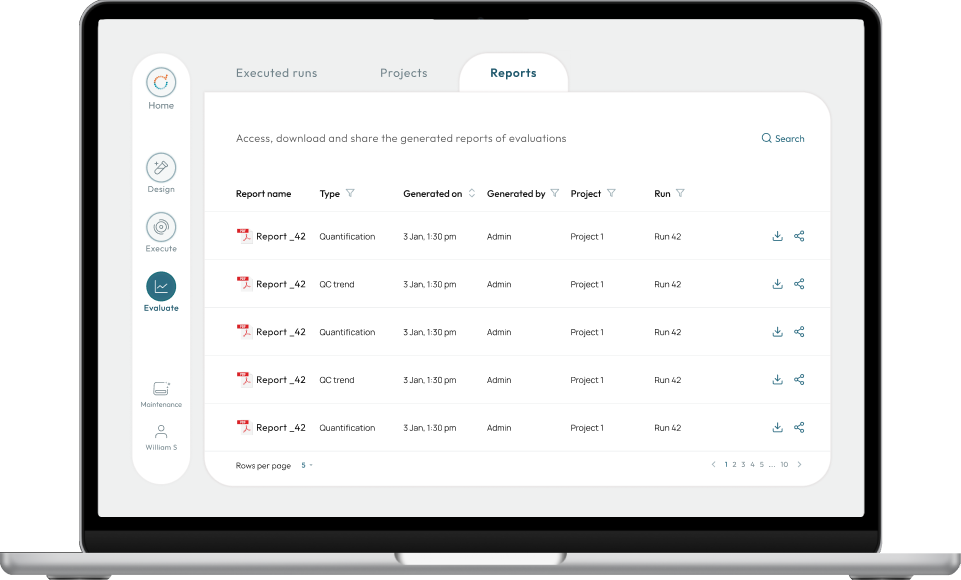
Made managing and finding historical data easy.

Tagging system and global search feature turned the folders into a catalogue.

Reports tab: a table of generated reports filtered by type, project and run, with download and share buttons.
NameStageFolderTags
new-run 1RawProject 1Protein A
new-run 2RawProject 2Protein B
new-run 3Before processingProject 1Protein A
Insight

An experiment's data is saved at each stage and is used to analyse and compare raw and post-processed data in a report. Users saved with a placeholder name and folder, "new-run x", to move forward quickly. Later, their peers struggled to find the right data, and finding it took a conversation outside the software.

DESIGN DECISION

Introduced tagging system that makes properties easy to access. Global search extracts keywords from metadata.  

Outcome

Related data is easy to find across all folders, and easy to compare. The keywords sit on the landing page for easier access to historical data.

Visual language

A tactile, calm look that blends into the lab. The machine stays in focus.

The client needed the product to stand out from their competitors. I based the visual design on the physical machines, so that the machine gets in focus and the software feels like its controller. 

It put the client's patented technology at the centre. The 1st phase ended with designing 12 key screens and shipping design system with 40 components, modelled on their hardware.

Impact

The client extended the engagement

Trainees and experts both got a shorter path, and the client asked us to stay.

42%

fewer steps in the task flow for trainees.
(compared to the old system)

32%

fewer steps in the task flow for experts.
(compared to the old system)

~$1500

lowered onboarding cost per trainee.
(estimated: average trainee salary x training time saved)

"I showed the screens to the team. This is a clear improvement. Let's go ahead."

Product Manager, lab software client (NDA)

"It took many iterations but you figured what we wanted."

Product Manager on the home page design (NDA)