5 people price one home. I built them one platform to work from.

A prop-tech start-up helps families sell their old home and put that money straight into a better one. It promises a quick offer and data-backed pricing. I designed the enterprise suite behind that promise, so the team could give personal service without slowing down.

AreaConditionPhotosDocumentsProperty recordAREACONDITIONPHOTOSDOCUMENTSCollecting on site…Ready for pricing
My role
UX designer. Owned the field app end to end. Co-designed the CRM, dashboards and internal tools in a team of 3.
PRODUCT DESIGNED
CRM, dashboards, data collection app and internal tools
DETAILS
Consultancy project with Twist Open UX. 1 year, 3 months
STAKEHOLDER COMMUNICATION
Presented to the client's CEO and CTO. Worked closely with product, marketing and engineers.
Problem

Selling one home and buying another took 3-6 months, with 5 roles passing data back and forth. Slow and exhausting for families. Risky and inefficient for the start-up.

Solution

I designed a CRM that turns a customer's sell and buy into one ticket journey. It brings the data and the decisions into one workflow.

Outcome

Personalised service, and an offer within 5 days.
6 tools became 1 CRM.
~40% more capacity for the team.
The start-up grew from 1 city to 4 on the same system.

Fair prices came from a pricing model. The model ran on the data collected about every property.

The property market in India is fragmented by region and mostly unorganised, so people had to gather the data, from several teams, one home at a time.

The start-up began with real-estate experts, partnerships and 6 tools, each with its own database.

Problem

Families lose patience selling one home and buying the next. Firms lose time, money and opportunity.

Selling and buying a home is slow and exhausting. The start-up was juggling spreadsheets, brokers, developers and legal teams.

Call centre Relationship manager Home visit expert Pricing manager Partner Property 1 Property 2 Property 3
~3-6 

months to sell the old home and buy the new one.

5

outside parties a family dealt with on top of that: brokers, developers, legal, dealers and agents. The CRM now pulls their data into one place.

6

tools in the start-up, each with its own database.

?

People:
Chasing data left no time for customers.

Finding the latest version meant a phone call. Reviewing numbers meant another. The calls ate the time meant for checking the numbers.

Process:
Every number was typed, checked and moved.

Each extra pass cost time and people, and gave something a chance to slip through. It slowed the pricing, and so the offer to a family waiting to sell their old home.

Money:
Every handover carried a risk.

Data moved between people, tools and tabs. A missed edit or message that didn't land was risky. On a ₹1 crore home (≈ €100,000), a 1% slip costs about ₹1 lakh (≈ €1,000).
KEY DESIGN DECISIONS · 1/4

Two journeys, one customer page. Specialists own the tasks. One relationship manager owns the customer.

RelationshipmanagerOLD HOME · SELLNEW HOME · BUYData collectionPricingNegotiationOfferHome viewingPricingNegotiationPurchaseSale funds the purchaseMove in
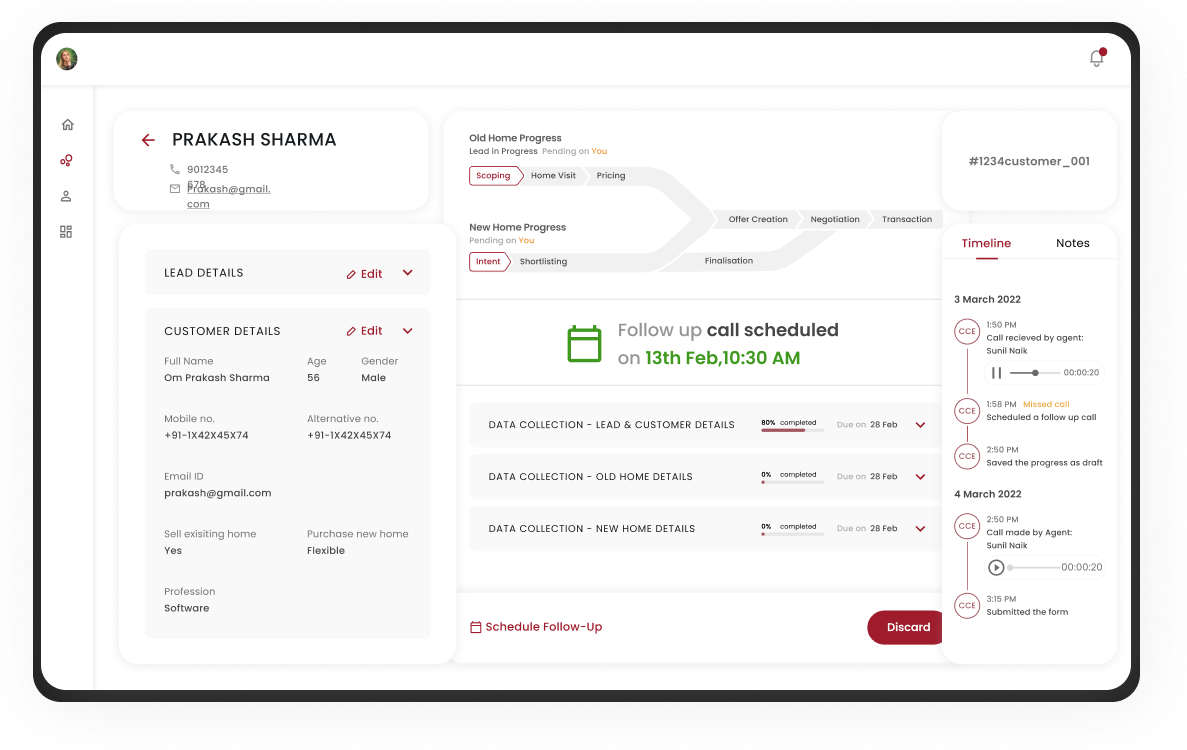
The CRM customer page in three panels. On the left, customer details. In the centre, old and new home progress by stage, a follow-up call banner, and accordions for each data collection step with percentage completed and due date. On the right, a timeline of calls and notes.
Insight

Each ticket holds two journeys: selling the old home and buying the new one. Splitting them into phases showed which of the 5 roles does what.
Each of the 5 roles gets its own view of the work. Customer data stays private to the relationship manager, because it's sensitive.

Design decision

Panels built around how people compare: customer details beside the work, actions on top, both journeys in the centre, one shared timeline.

Outcome

Every interaction is traceable. Specialists price, the relationship manager looks after the client. Same ticket, personalized service offered quicker so more tickets fit in a week.

KEY DESIGN DECISIONS · 2/4

A field app turned an awkward home visit into a standard routine.

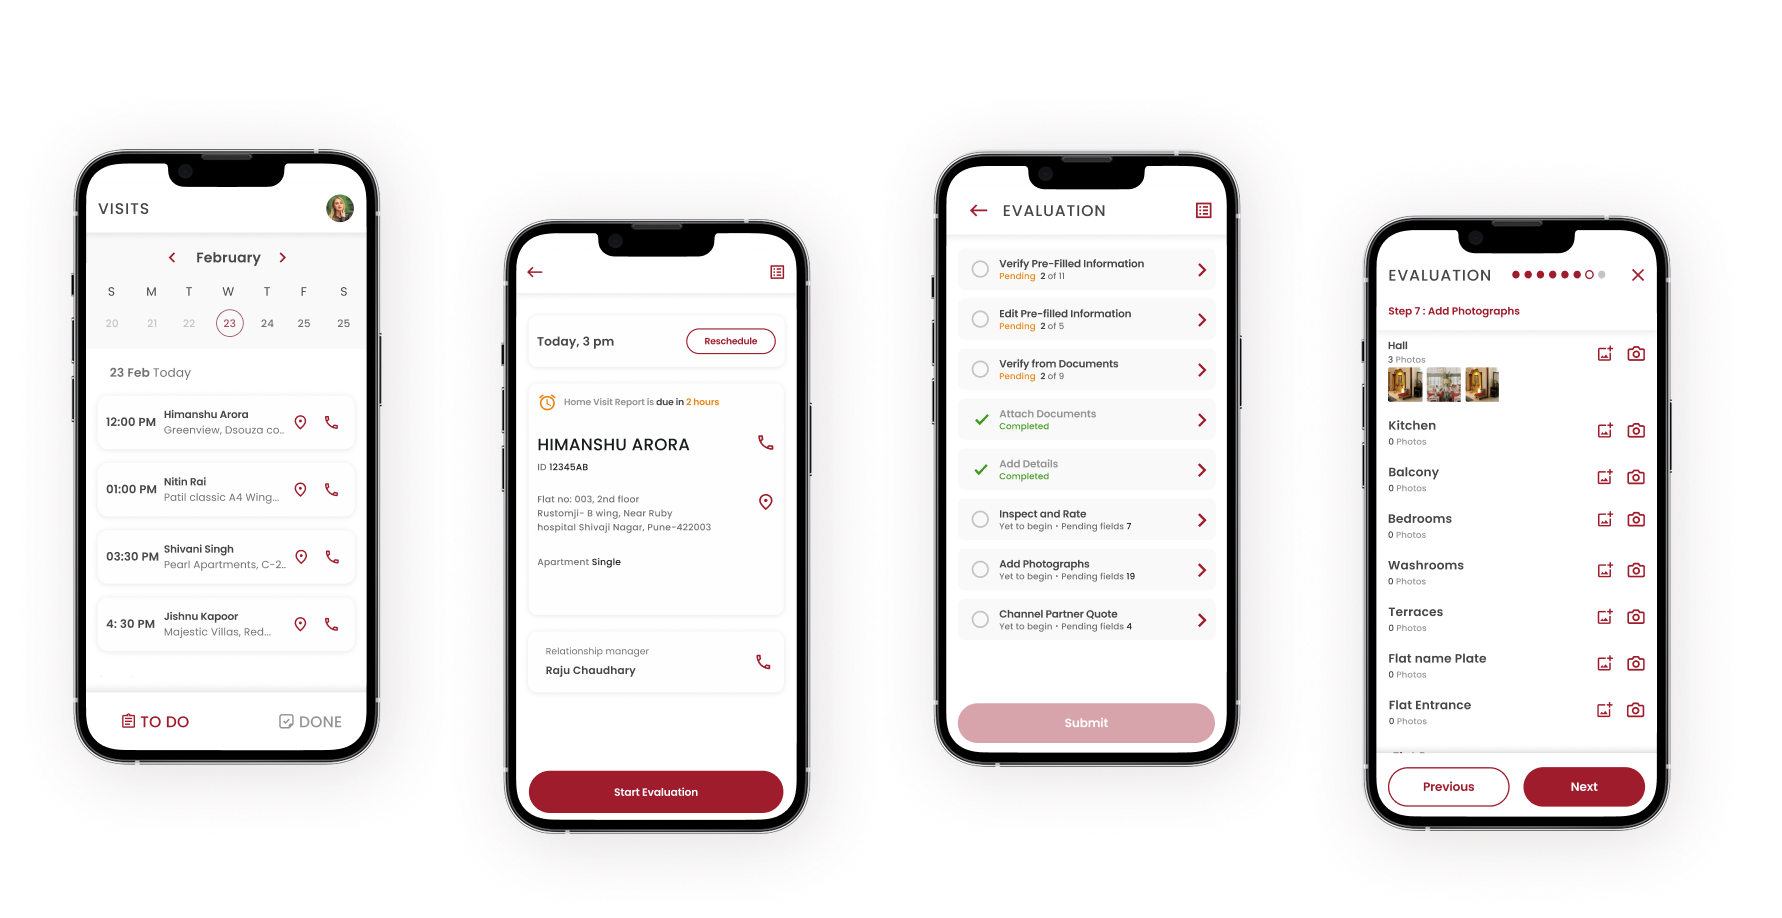
Four screens of the field app: a calendar of the day's visits, a customer profile with an address and a Start evaluation button, a list of evaluation parameters marked pending or completed, and a photo step with a row for each room.
Insight

Old-home data is collected during the home visit, in front of the owners. Documents, photos of personal spaces, and its conditions need to be inspected. An awkward moment to be working through a long form.

Design decision

I designed the app that reorganized data around the visit aiming for quickest completion. It opens on the day's calendar and the customer's details, then walks the expert through tasks: verifying, editing, inspecting, collecting. Less time on site, and communication with customers becomes a standard, professional walkthrough.

Outcome

Data is captured once, at the source, and lands in the CRM. Fewer errors, less time validating.
Visit feels professional and trustworthy.
Adopted by home visit experts into their daily workflow.

KEY DESIGN DECISIONS · 3/4

Clarity for risky pricing decisions.
Flexibility for customers who change their minds.

Accept, reject, send back, delete or discard, at the step where it belongs.

Enter in a sheetAsk someone to checkFix in a tabAsk again

Each hop depended on a message or a call reaching the right person.

Maker entersChecker reviews in placeAcceptRejectSend back

Every outcome and every note stays on the customer's timeline.

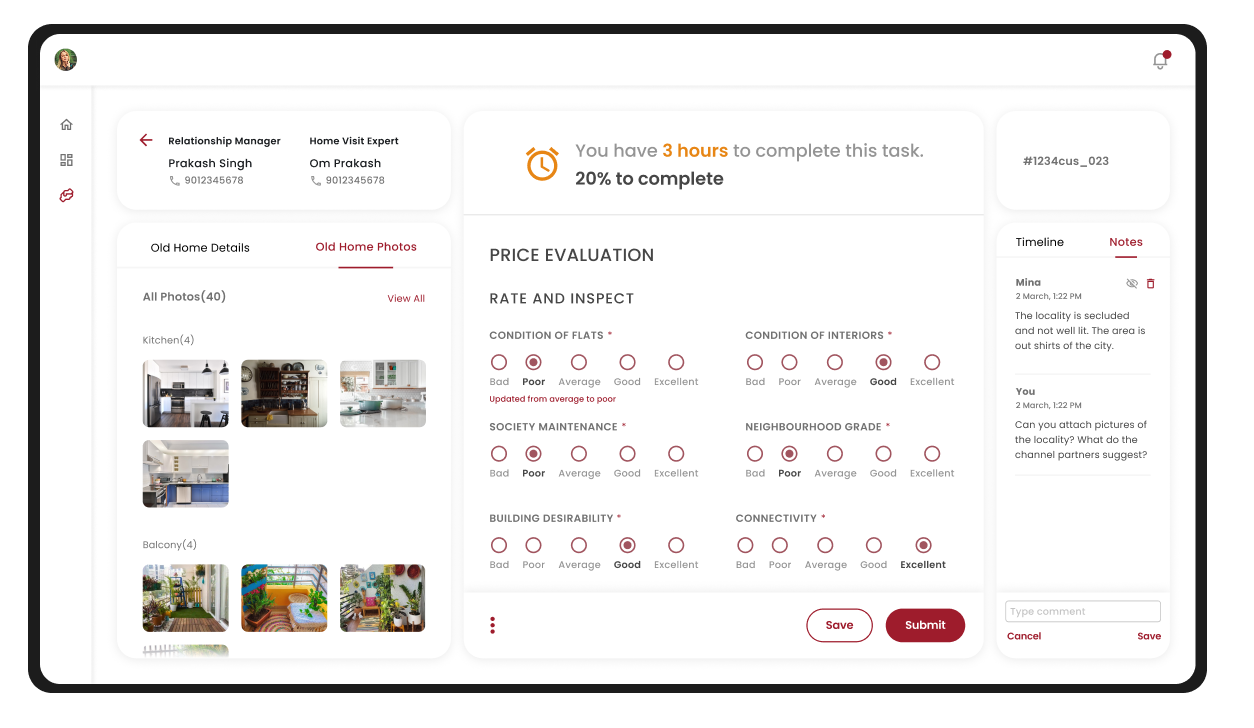
The price evaluation screen: old home photos by room on the left, a rate-and-inspect form with Bad to Excellent scales in the centre, a countdown to the deadline above it, and a notes panel on the right where the checker and the maker leave comments.
Insight

Selling and buying a home is emotional, risky for families. They change their mind, negotiate prices, decline and come back.

Design decision

A built non-linear ticket's journey in the system by mapping the average path and the edge cases before designing screens. We accounted ticket actions based on them: accept, reject, send back, delete and discard.

Outcome

Every action is logged, so a family who walked away can pick up where they left off to restart their journey.
Their behaviour gets mapped in buying and selling trends, which helped the team plan catalogues and personalise service.

Key design decisions · 4/4

The system keeps data organised and tagged, for today's pricing and tomorrow's trends.

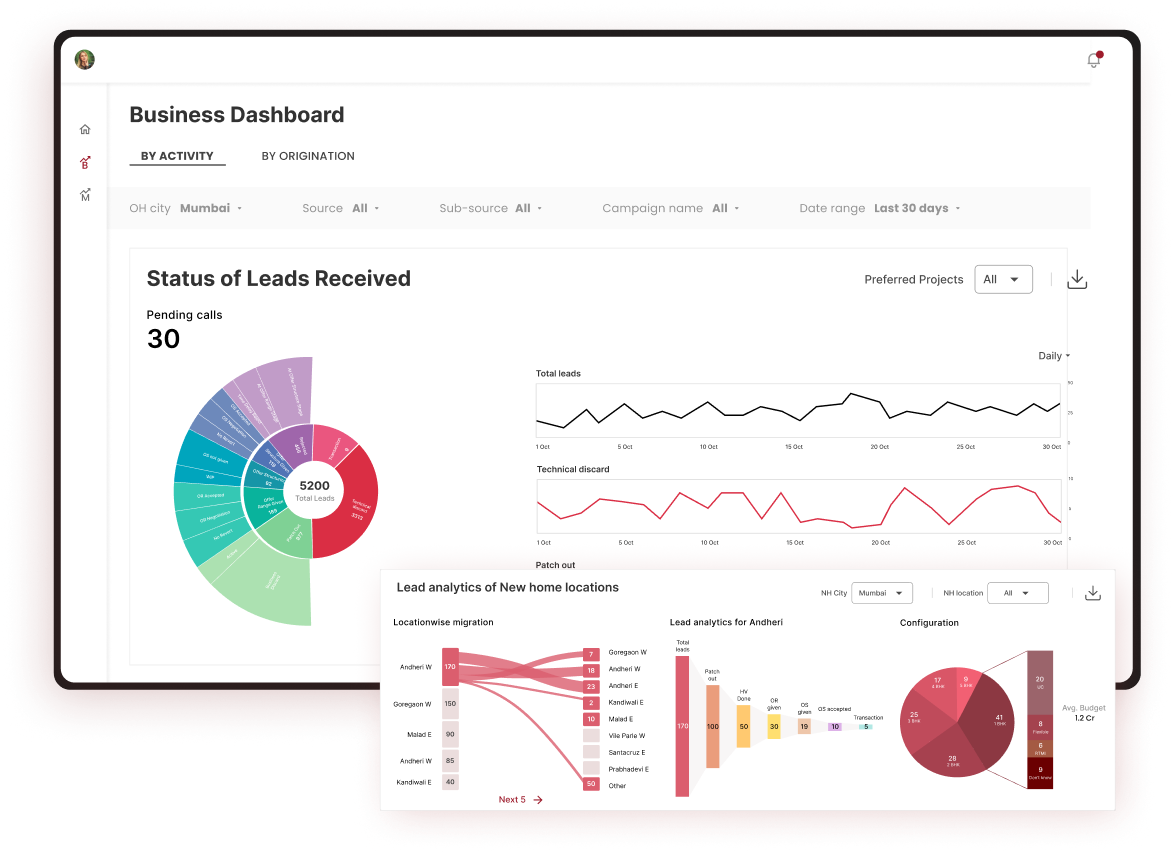
The business dashboard: status of leads received as a sunburst chart, daily trend lines for total leads and technical discards, and a panel of lead analytics by location with migration flows and budget configuration.

Leadership dashboard

A view for leadership of how leads flow and convert, so they could spot trends and shape marketing.

Customer-facing form

A short form on the client's website that checks whether a visitor is a good fit as a customer.

Impact

One CRM. One traceable path. An offer in 5 days. And trust built into the service.

Measured5 days

committed offer time on the old home, down from 8-10 days.

Derived~40%

more capacity to handle clients. Estimated from the shorter offer time, with the same team.

Context~30-40

tickets a week, handled by a specialised team of 12 people. The start-up also grew from 1 city to 4.

Entering data, reviewing it, deciding and collaborating happened in one place, not over phone calls.
The team saved time and energy, and service quality improved.

OUTCOME OF DESIGN

1. The field app became the home visit experts' daily tool.
2. The CRM and dashboards moved the work out of Excel sheets and phone calls into one system, with a clear role and task for each person.
3. Customers got an offer in a committed time.